.png?width=256&height=60&name=Logo%20(1).png)
The Reports Tab provides insights on the usage, scores, sessions and mistakes made by users when consuming a Pixaera training module. The data collected provides actionable insights to help identify areas of strengths or weaknesses in your organisation.
Note: Data is not displayed for ‘Offline Mode’ VR sessions
The reports page is divided into the following areas:
- Overview
- Activity
- Performance
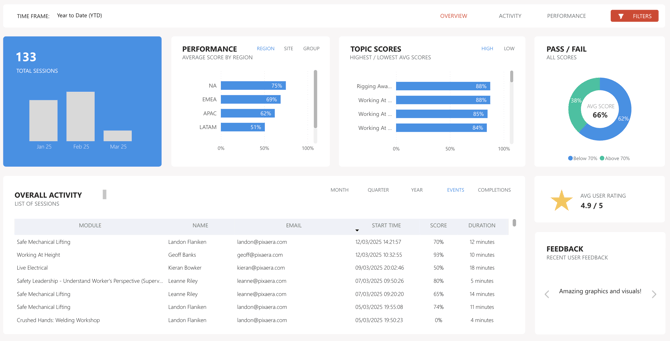
Overview Page
The overview page allows to check the overall activity in your account. At a glance, you can see the sessions completed, how scores vary by region and site and the various feedback from the trainees themselves.
This page contains high level information on the following data and questions they should help you answer:
- Sessions - Who is completing the training?
- Scores by Region - How are our different regions performing?
- Scores by Topic - Which are our strong training topics and where do we still have work to do?
- Overall activity including users - Training records at a glance
- Pass/Fail rate - Are we mostly passing? Does the failure rate change over time?
- User ratings and feedback - How are my trainees finding the content? Is it effective and useful for them?
Activity Page
This page gives you a great understanding of how your teams are engaging with the training content. It allows you to take a closer look at the following:
- Number of sessions over time - Are we seeing an increase here as we deploy to more regions?
- Users v Sessions by Region - Are some regions showing low engagement? Maybe they need some additional support
- Topic Activity - Which topics do we cover regularly and which could the team use a refresher on?
- User completion rate - How is this tracking over time?
- Activity by channel, e.g. VR/streaming - Is this where we would expect it to be? Would we like to change our focus to streaming to make it more scalable and track that?

Performance Page
This page is designed to help you uncover your team readiness. Are they passing key safety modules on the first attempt, or do they need help with a specific area? It dives deep into the numbers, giving you insights on the following trends:
- Average score over time - Are we seeing an increase or has it plateaued?
- Pass/Fail Rates - How are my teams performing across topics?
- Score comparison, including industry benchmarks - This allows you to benchmakr your team’s performance against industry standards, providing a clear picture of where you can improve.
- Knowledge gaps for each module/topic - Laser-focused view of where your workforce may be struggling, helping you identify weak spots
- Intervention Trends - This shows the percentage of users who identified a need for action within a scenario, helping you assess the proactivity of your workforce.
- Failure trends - This gives you deep insights into how your teams are performing across topics.
- Average number of attempts before passing

Filters
It is also possible to filter by the following to load the data most relevant to you:
- Date - A variety of options including a custom range
- Region/Site/Group - Please refer to this guide if you haven’t already set any up
- Platform, e.g. VR/Streaming
- Email address
- Topic - Or module
- User Type - Classroom Hosts or Learners. If you roll out training on a one-to-one basis, you will only have learners. If you run classroom sessions in Pixaera, you may have classroom hosts that you can filter by to load data from their sessions only.
You can find the filters on the right hand side, this is what the button looks like:

FAQ
Can you export Reports?
We currently do not support the download of reports directly from the Pixaera web app, however, this data can be retrieved upon request. Please reach out to your Pixaera representative.